KLCC: Land Surface Temperature
(1989 & 2019)
Slide right for 1989 analysis, left for 2019.
A study by Think City showed an increase of 1.64°C in Kuala Lumpur City Centre's surface temperature between 1989 and 2019.
In December 1989, the highest recorded surface temperature in Kuala Lumpur City Centre (KLCC) was 29.40°C, while the lowest was 21.07°C. The hottest areas identified were the City Centre, Bukit Bintang, Pudu and North KL (Chow Kit, Kampung Baru). Brownfield sites around Jalan Ampang (now KLCC) also contributed to the high temperature in 1989. Places that recorded temperatures over 29°C were Sungei Wang Plaza in Bukit Bintang and areas surrounding Jalan Pudu. Mahameru and Jalan Puncak (KL Forest Eco Park) were identified as the cooler areas due to surrounding woodlands and limited development seen at the time.
In October 2019 the highest and lowest recorded temperatures in Kuala Lumpur's City Centre were 31.04°C and 23.34°C. This revealed an increase of 1.64°C between 1989 to 2019's highest recorded temperatures*. Hottest spots include the same areas as before; City Centre, Bukit Bintang, Pudu, North KL and institutions surrounding Jalan Dato Onn' and Jalan Tun Ismail located southwest of Chow Kit. Over the past three decades, Petronas Towers was also completed and served as the catalyst for Kuala Lumpur's development. This is supported by latest satellite data, which revealed a significant increase in the city's built environment leading to the rise of surface temperature.
On the other hand, there were a few locations that decreased and/or steadied in temperature in 2019. Based on satellite data and Think City's 2019 LST observation, park reserve areas such as KL Forest Eco Park and Taman Botani Perdana, and public spaces and gardens in Mahameru and KLCC were observed as the cooler areas in the city.
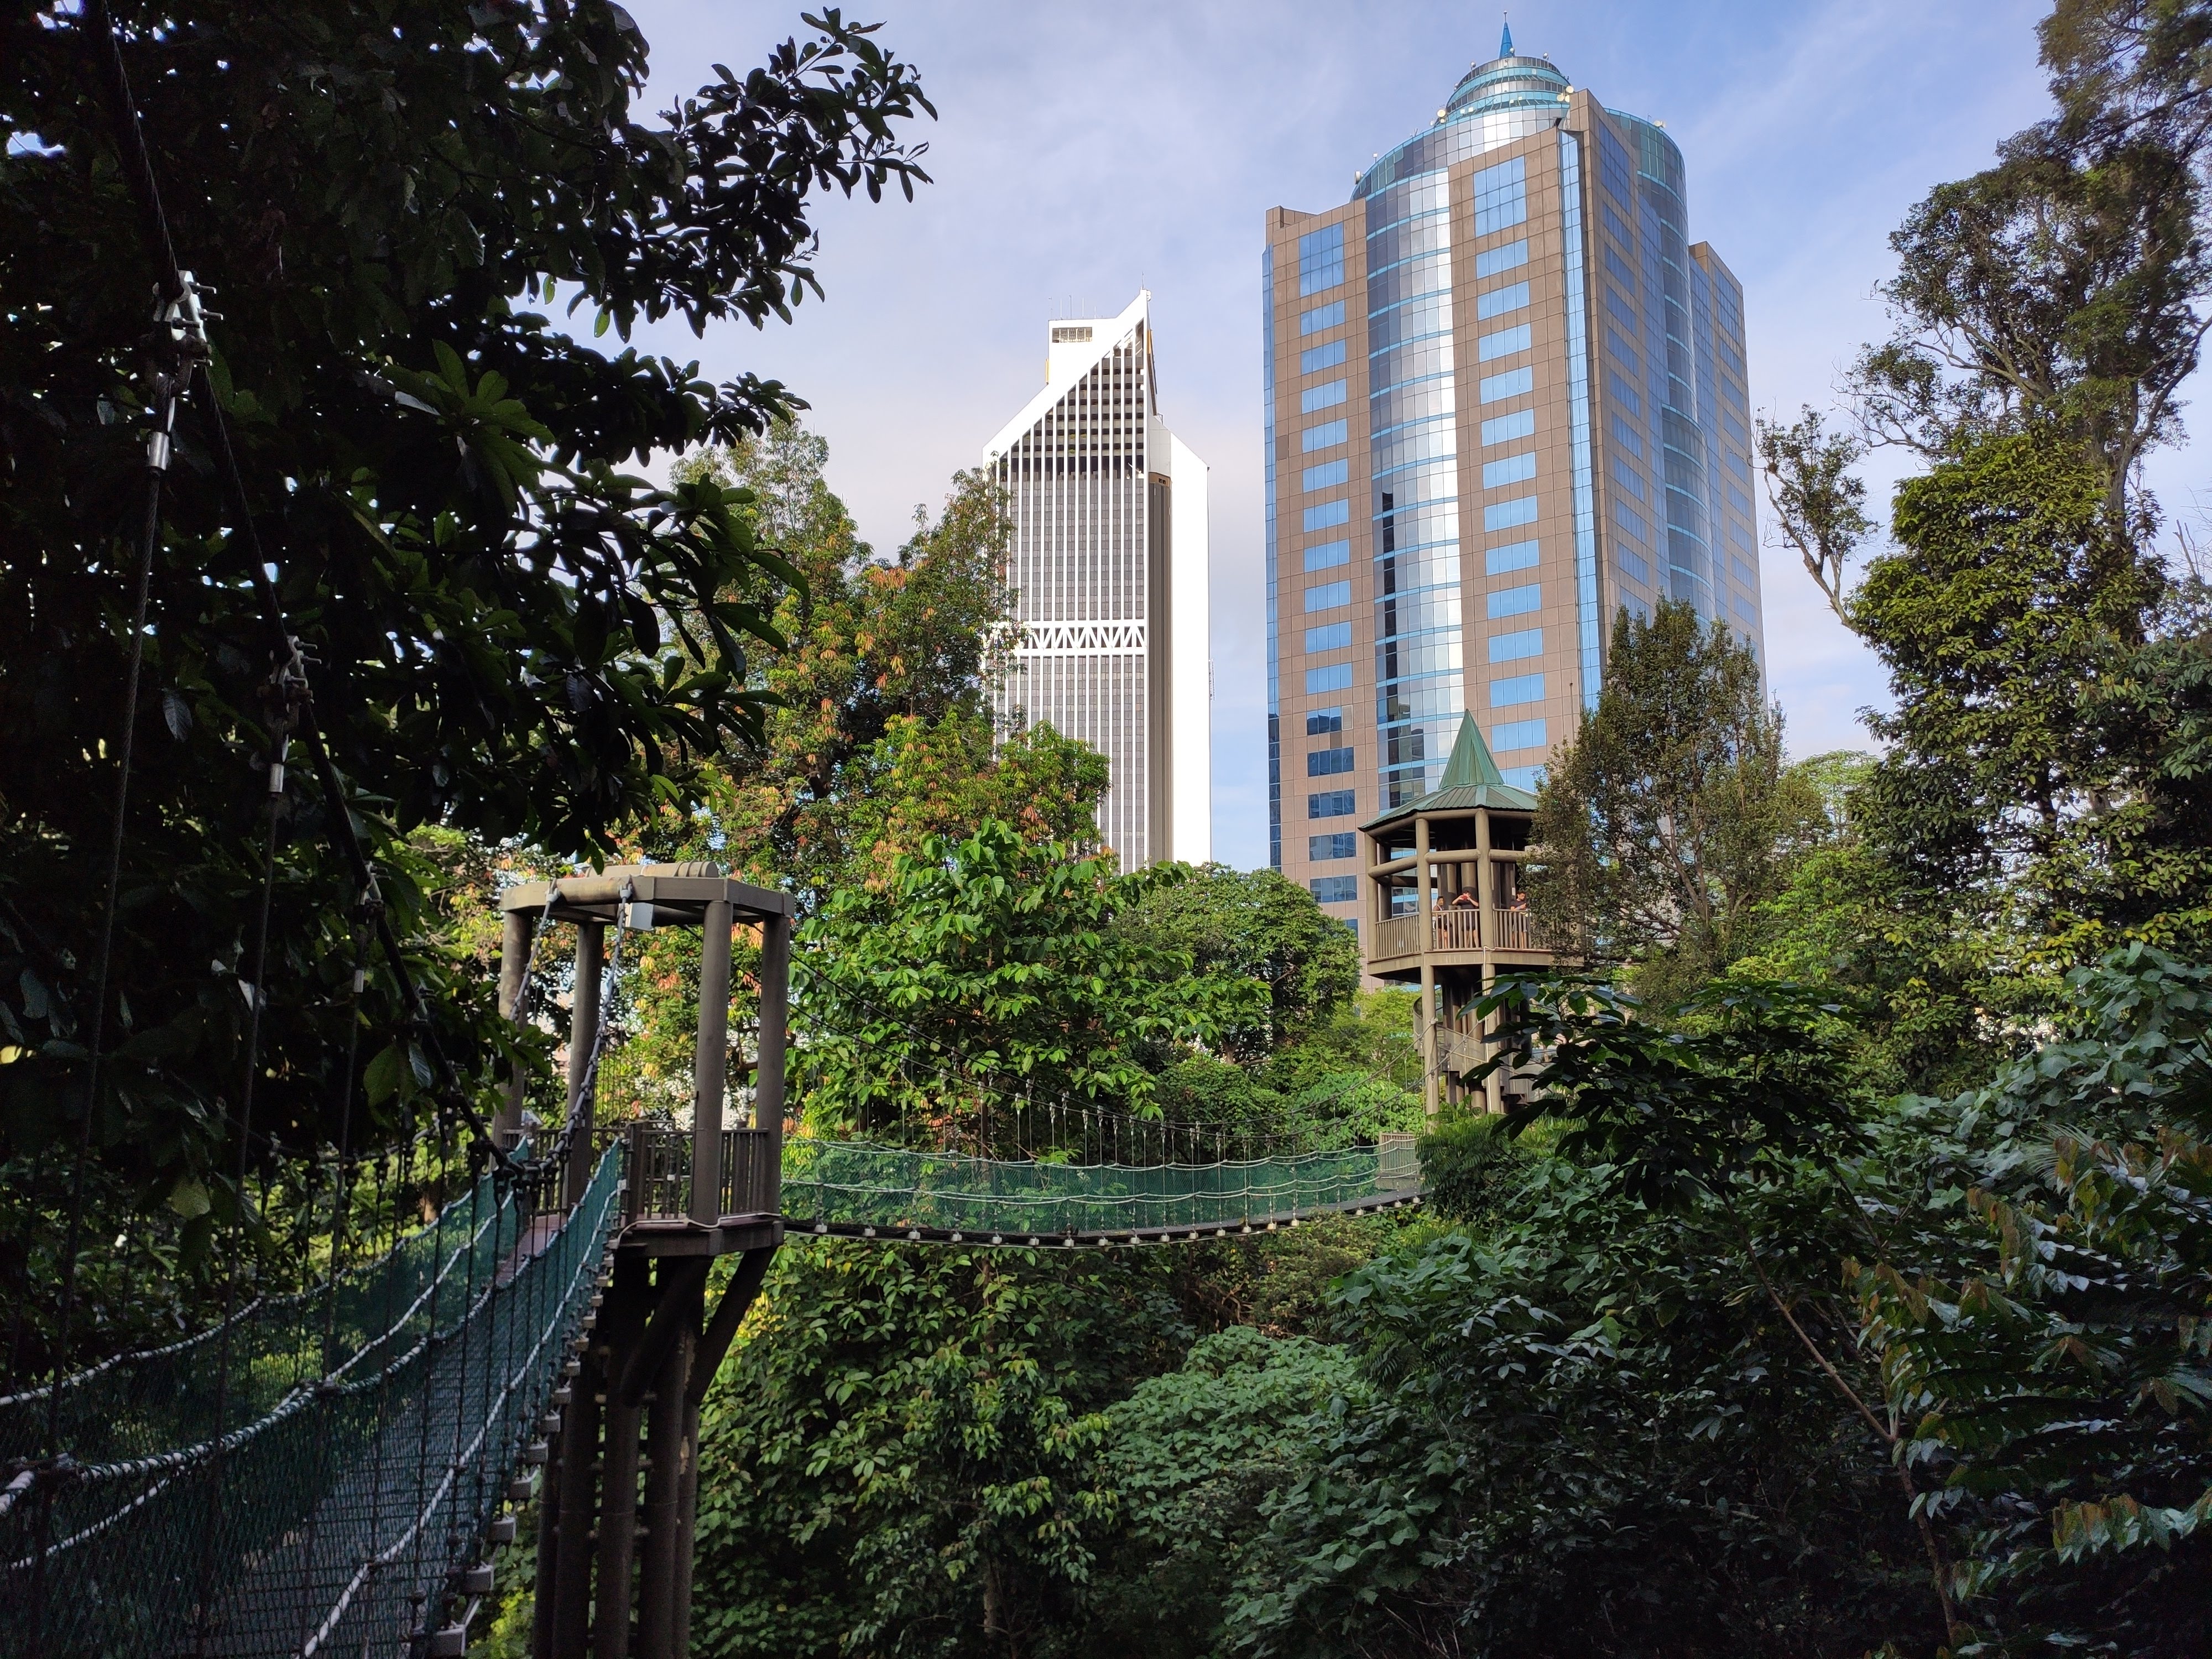
Kuala Lumpur Forest Eco Park
These observations conclude that an increase in a city's built environment (buildings, man-made surfaces, asphalt highways and roads) will naturally increase its Urban Heat Island (UHI) effects (e.g. rise in surface temperature). The increase of 1.64°C may seem unsubstantial, however, it indicates a slow yet steady rise in the city's peak temperature and is representative of the global climate change phenomenon. Nonetheless, compared to other Malaysian cities, KLCC has been able to demonstrate the effectiveness of its domestic gardens, parks, and woodlands in reducing the city's heat, giving it the proper mechanisms to breathe. According to LEAF (2015), green spaces also indirectly benefit human health by improving air quality and limiting the shock of heatwaves through the reduction of urban temperatures.
*Disclaimer: This value does not reflect the temperature change of Greater Kuala Lumpur
Methodology
LST is measured by collecting specific data (e.g. thermal, red and near-infrared bands) from a Landsat dataset to feed into a Geographic Information System (GIS) model, which then processes and combines the data with relevant parameters to determine the final LST value. Key parameters include top of atmosphere reflectance and brightness temperature, thermal emissivity and vegetation health data.
Disclaimers
The methodology does not include the direct collection of physical and biological information of objects (e.g. manmade, vegetations, water bodies, etc) in the study areas; rather it is based on a remote quantitative estimation of LST values, which can greatly vary depending on changes in surface energy. Surface temperature data are prone to errors due to clouds and cloud shadows, thus certain areas may have their temperatures underestimated. Temporal measurement is different for each city as timeframes could not be standardised (except for George Town and Bayan Lepas) due to data limitations; and was captured by two different satellites (Landsat 5 and Landsat 8) with slightly different thermal sensing capacity. Study areas also varied in sizes and some may show greater extremes in temperature change due to the capacity of larger areas to evolve and change (e.g. accept more substantial physical changes; for example, Johor Bahru district has more spatial capacity for further development compared to Kuala Lumpur City Centre).
References
►Hashim, N.B.M., Ahmad, A. and Abdullah, M., 2007. Mapping urban heat island phenomenon: Remote sensing approach.
The Institution of Engineers, Malaysia, 68, pp.25-30.
►Malakar, N.K., Hulley, G.C., Hook, S.J., Laraby, K., Cook, M. and Schott, J.R., 2018. An operational land surface temperature product for Landsat thermal data: Methodology and validation.
IEEE Transactions on Geoscience and Remote Sensing, 56(10), pp.5717-5735.
►Mustafa, E.K., Co, Y., Liu, G., Kaloop, M.R., Beshr, A.A., Zarzoura, F. and Sadek, M., 2020. Study for Predicting Land Surface Temperature (LST) Using Landsat Data: A Comparison of Four Algorithms.
Advances in Civil Engineering, 2020.
►Cook, M., Schott, J.R., Mandel, J. and Raqueno, N., 2014. Development of an operational calibration methodology for the Landsat thermal data archive and initial testing of the atmospheric compensation component of a Land Surface Temperature (LST) product from the archive.
Remote Sensing, 6(11), pp.11244-11266.
Sources
Data source: United States Geological Survey (USGS)
Data sets: Landsat Missions 5 and 8

Land Surface Temperature of Kuala Lumpur City Centre
Land surface temperature of Kuala Lumpur City Centre in 1989 and 2019.