Johor Bahru: Land Surface Temperature
(2005 & 2018)
Slide right for 2005 analysis, left for 2018.
A study by Think City showed an increase of 6.7°C in Johor Bahru's surface temperature between 2005 and 2018.
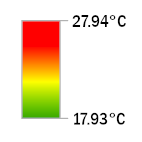
In May 2005, the highest recorded surface temperature in Johor Bahru (JB) district was 27.94°C, while the lowest was 17.93°C. The hottest areas were Skudai, Seri Purnama, Bandar Johor Bahru and Pasir Gudang, reaching temperatures over 25°C. Seri Purnama and Pasir Gudang were, and still are, sites with many heavy industries of transportation and logistics, petrochemicals, electronics, and plastics. Meanwhile, Skudai and Bandar Johor Bahru are highly concentrated with population and business areas. In comparison, the north of JB – particularly Tebrau – were still greenfield sites and reported lower temperatures.
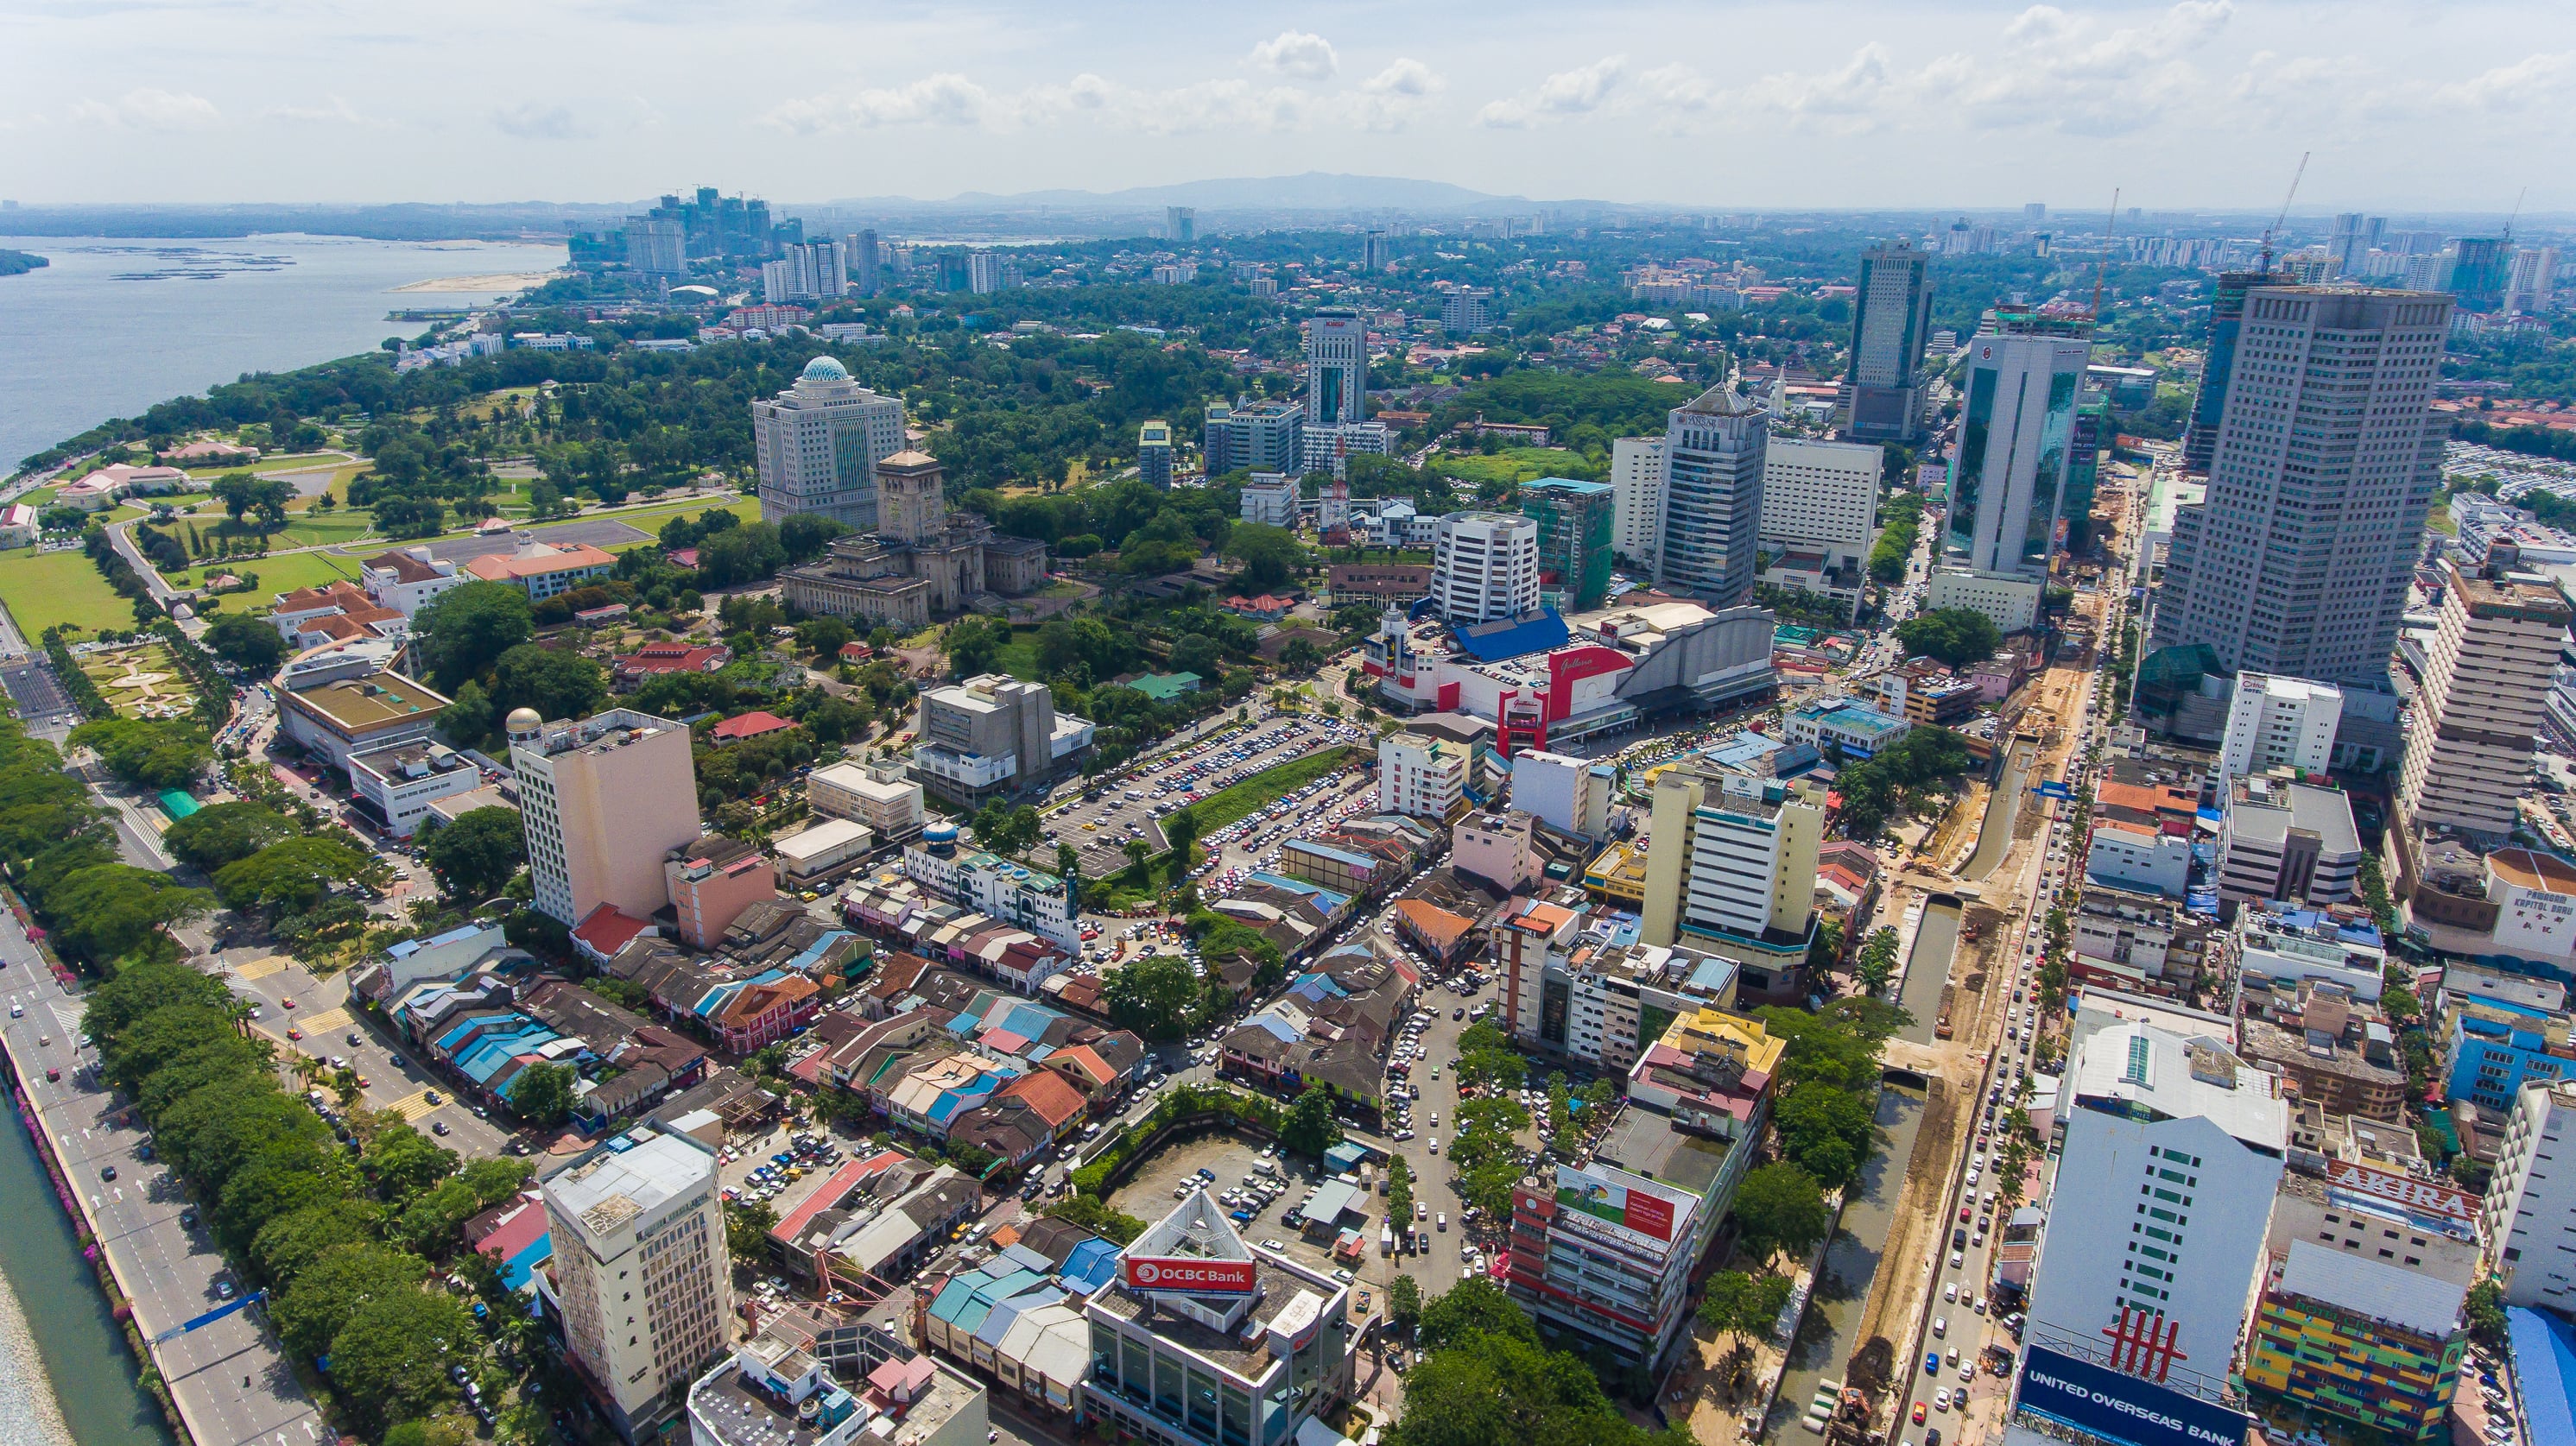
Bandar Johor Bahru (Courtesy: Geo Sense Sdn Bhd)
In 2005, the east of JB (along Kampong Ayer Puteh) recorded surface temperatures between 19°C and 25°C. This was uncharacteristic due to the forest landscapes surrounding the deltas of Sungai Johor at the time. A closer look at the 2005 vegetation index data affirms that these landscapes had been deforested, explaining the high land surface temperature (LST) variations across the land (approximately up to 40 km²) (Figure 1). However, in 2018, the temperatures of these areas dropped by a maximum of 2°C. Further inspection revealed that they had been repopulated with oil palm plantations, indicating monoculture activities. Monoculture brings forth negative environmental impacts, such as inferior carbon sequestration ability (compared to natural forests), loss of biodiversity, and loss of soil quality.
Figure 1: Cleared forest landscapes in east of JB in 2005
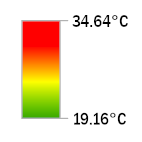
In May 2018, there was a distinguishable temperature increase in JB's built environment, especially in Nusajaya, Bandar Dato' Onn near Tebrau and Tanjong Langsat. The highest and lowest recorded temperatures were 34.64°C and 19.16°C, respectively. This revealed an increase of 6.7°C between 2005 and 2018's highest recorded temperatures. This substantial rise in temperature is attributed to JB's rate of gentrification and increase in number of steel industries, particularly in Kawasan Perindustrian Tanjung Langsat and Pasir Gudang which recorded land surface temperatures over 33°C.
These observations conclude that, between 2005 and 2018, Johor Bahru had substantially expanded its physical landscape. Coupled with the fact that Johor is situated near the earth's equator, the effects of global temperature rise has naturally amplified JB's local LST.
Methodology
LST is measured by collecting specific data (e.g. thermal, red and near-infrared bands) from a Landsat dataset to feed into a Geographic Information System (GIS) model, which then processes and combines the data with relevant parameters to determine the final LST value. Key parameters include top of atmosphere reflectance and brightness temperature, thermal emissivity and vegetation health data.
Disclaimers
The methodology does not include the direct collection of physical and biological information of objects (e.g. manmade, vegetations, water bodies, etc) in the study areas; rather it is based on a remote quantitative estimation of LST values, which can greatly vary depending on changes in surface energy. Surface temperature data are prone to errors due to clouds and cloud shadows, thus certain areas may have their temperatures underestimated. Temporal measurement is different for each city as timeframes could not be standardised (except for George Town and Bayan Lepas) due to data limitations; and was captured by two different satellites (Landsat 5 and Landsat 8) with slightly different thermal sensing capacity. Study areas also varied in sizes and some may show greater extremes in temperature change due to the capacity of larger areas to evolve and change (e.g. accept more substantial physical changes; for example, Johor Bahru district has more spatial capacity for further development compared to Kuala Lumpur City Centre).
References
►Hashim, N.B.M., Ahmad, A. and Abdullah, M., 2007. Mapping urban heat island phenomenon: Remote sensing approach.
The Institution of Engineers, Malaysia, 68, pp.25-30.
►Malakar, N.K., Hulley, G.C., Hook, S.J., Laraby, K., Cook, M. and Schott, J.R., 2018. An operational land surface temperature product for Landsat thermal data: Methodology and validation.
IEEE Transactions on Geoscience and Remote Sensing, 56(10), pp.5717-5735.
►Mustafa, E.K., Co, Y., Liu, G., Kaloop, M.R., Beshr, A.A., Zarzoura, F. and Sadek, M., 2020. Study for Predicting Land Surface Temperature (LST) Using Landsat Data: A Comparison of Four Algorithms.
Advances in Civil Engineering, 2020.
►Cook, M., Schott, J.R., Mandel, J. and Raqueno, N., 2014. Development of an operational calibration methodology for the Landsat thermal data archive and initial testing of the atmospheric compensation component of a Land Surface Temperature (LST) product from the archive.
Remote Sensing, 6(11), pp.11244-11266.
Sources
Data source: United States Geological Survey (USGS)
Data sets: Landsat Missions 5 and 8

Land Surface Temperature of Johor Bahru District
Land surface temperature of Johor Bahru district in 2005 and 2018.