Ipoh City: Land Surface Temperature
(1998 & 2019)
Slide right for 1998 analysis, left for 2019.
A study by Think City showed an increase of 6.75°C in Ipoh City's surface temperature between 1998 and 2019.
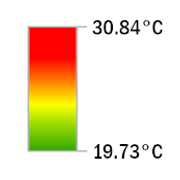
The study area includes the administrative divisions of Chemor and Lahat which neighbours Ipoh in the north and south, respectively to observe the peripheral change surrounding Ipoh's landscape. In November 1998, the highest recorded surface temperature in Ipoh was 30.84°C, while the lowest 19.73°C. The landscape was already heavy with development and many lands had been cleared for construction, particularly in the south. Hotspots included Sultan Azlan Shah Airport, neighbouring industries such as Kawasan Perindustrian Menglembu and Kawasan Perindustrian Sri Rapat, and Ipoh City Centre where localities were heavily concentrated with human activities and local economies.
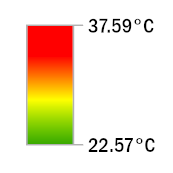
In March 2019, the highest and lowest recorded temperatures were 37.59°C and 22.57°C. This revealed an increase of 6.75°C between 1998 to 2019's highest recorded temperatures. According to Think City's 2019 LST observation, surface temperature rose across all of Ipoh by a minimum of 2.8°C. Areas that fell into the maximum temperature range (1998 over 25°C; 2019 over 30°C) in 1998 increased by 245% in 2019 (from 66 km² to 163 km²), revealing the extreme change in Ipoh's urban and ecological environment. This indicates an unsustainable ecosystem that can affect human well-being, environmental conditions, and ecological resilience. Meanwhile, recreational green areas around Gunung Lang and Gunung Rapat have been preserved and, unsurprisingly, are some of the cooler areas in the city.
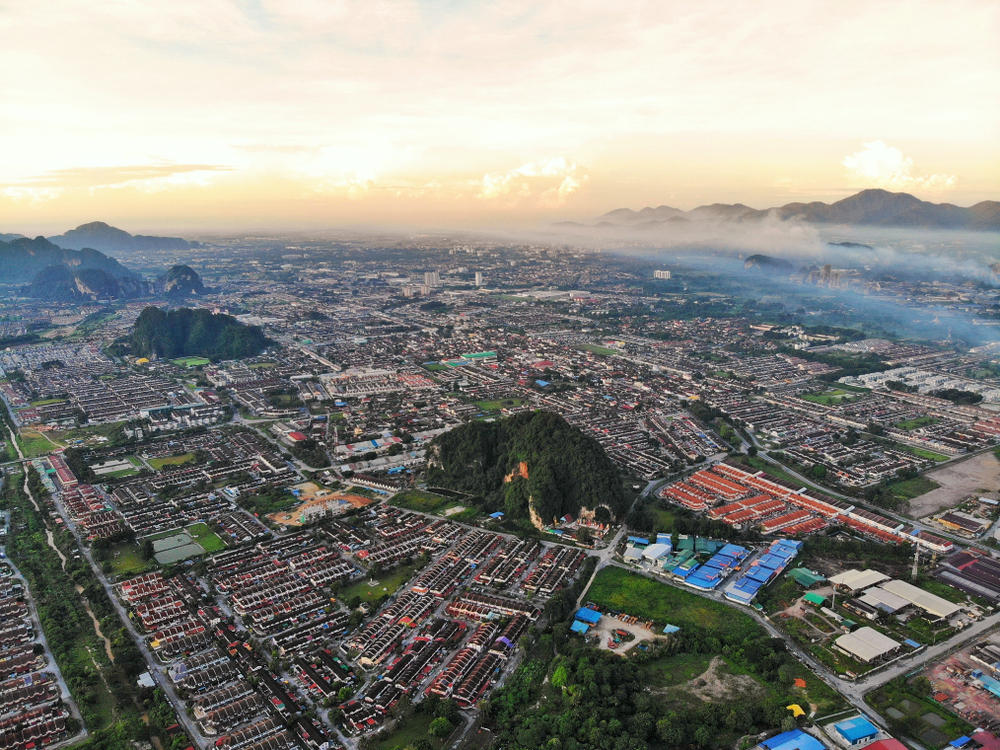
Aerial view of Bercham, Ipoh (Courtesy: Shutterstock)
Ipoh is one of Malaysia's largest cities, with relatively high population and economic densities. According to the World Bank, between 1998 and 2019, Ipoh's population is estimated to have increased by over 53% to over 800,000 people. Ipoh's growth of population is evidently correlated with its changes in urban physical landscape and increase in energy consumption. These are known to be precursors of greenhouse gas emissions and elevated Urban Heat Island (UHI) effects.
Methodology
LST is measured by collecting specific data (e.g. thermal, red and near-infrared bands) from a Landsat dataset to feed into a Geographic Information System (GIS) model, which then processes and combines the data with relevant parameters to determine the final LST value. Key parameters include top of atmosphere reflectance and brightness temperature, thermal emissivity and vegetation health data.
Disclaimers
The methodology does not include the direct collection of physical and biological information of objects (e.g. manmade, vegetations, water bodies, etc) in the study areas; rather it is based on a remote quantitative estimation of LST values, which can greatly vary depending on changes in surface energy. Surface temperature data are prone to errors due to clouds and cloud shadows, thus certain areas may have their temperatures underestimated. Temporal measurement is different for each city as timeframes could not be standardised (except for George Town and Bayan Lepas) due to data limitations; and was captured by two different satellites (Landsat 5 and Landsat 8) with slightly different thermal sensing capacity. Study areas also varied in sizes and some may show greater extremes in temperature change due to the capacity of larger areas to evolve and change (e.g. accept more substantial physical changes; for example, Johor Bahru district has more spatial capacity for further development compared to Kuala Lumpur City Centre).
References
►Hashim, N.B.M., Ahmad, A. and Abdullah, M., 2007. Mapping urban heat island phenomenon: Remote sensing approach.
The Institution of Engineers, Malaysia, 68, pp.25-30.
►Malakar, N.K., Hulley, G.C., Hook, S.J., Laraby, K., Cook, M. and Schott, J.R., 2018. An operational land surface temperature product for Landsat thermal data: Methodology and validation.
IEEE Transactions on Geoscience and Remote Sensing, 56(10), pp.5717-5735.
►Mustafa, E.K., Co, Y., Liu, G., Kaloop, M.R., Beshr, A.A., Zarzoura, F. and Sadek, M., 2020. Study for Predicting Land Surface Temperature (LST) Using Landsat Data: A Comparison of Four Algorithms.
Advances in Civil Engineering, 2020.
►Cook, M., Schott, J.R., Mandel, J. and Raqueno, N., 2014. Development of an operational calibration methodology for the Landsat thermal data archive and initial testing of the atmospheric compensation component of a Land Surface Temperature (LST) product from the archive.
Remote Sensing, 6(11), pp.11244-11266.
Sources
Data source: United States Geological Survey (USGS)
Data sets: Landsat Missions 5 and 8