Bayan Lepas: Land Surface Temperature
(1988 & 2020)
Slide right for 1988 analysis, left for 2020.
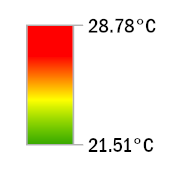
A study by Think City showed an increase of 5.63°C in Bayan Lepas' surface temperature between 1988 and 2020.
In February 1988, the maximum surface temperature recorded in Bayan Lepas was 28.78°C, while the minimum was 21.51°C. Bayan Lepas' landscape was 4 km² smaller than it is today due to land reclamation activities post 2008 (the dotted white line in 1988 represents pre-reclaimed land). In 1988, many areas of Bayan Lepas had been cleared away to house incoming industries and residences. Penang International Airport and existing industries in southwest of Bayan Lepas recorded temperatures in the higher range (over 28°C). This was associated with high level of human activities and thermal radiation emitted by the airport runway.
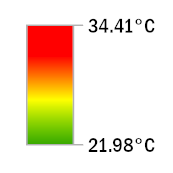
In February 2020, the highest and lowest recorded temperatures were 34.41°C and 21.98°C. This revealed an increase of 5.63°C between 1988 to 2020's highest recorded temperatures. The significant rise has been the consequence of increased industries and urbanisation in Bayan Lepas. Industrial areas (e.g. BL Free Industrial Zones, Diamond Valley Industrial Park), residential areas (e.g. Bandar Bayan Baru, Bayan Indah), and commercial areas (e.g. Qeensbay Mall, Penang International Airport) have recorded surface temperatures over 33°C. The area that recorded the minimum temperature of 21.98°C was an unoccupied and non-operational factory located in Lintang Kampung Jawa. This information proves how thermal pollution can be directly controlled and suppressed if circumstances permit e.g. a regulatory cap for industry thermal pollution.
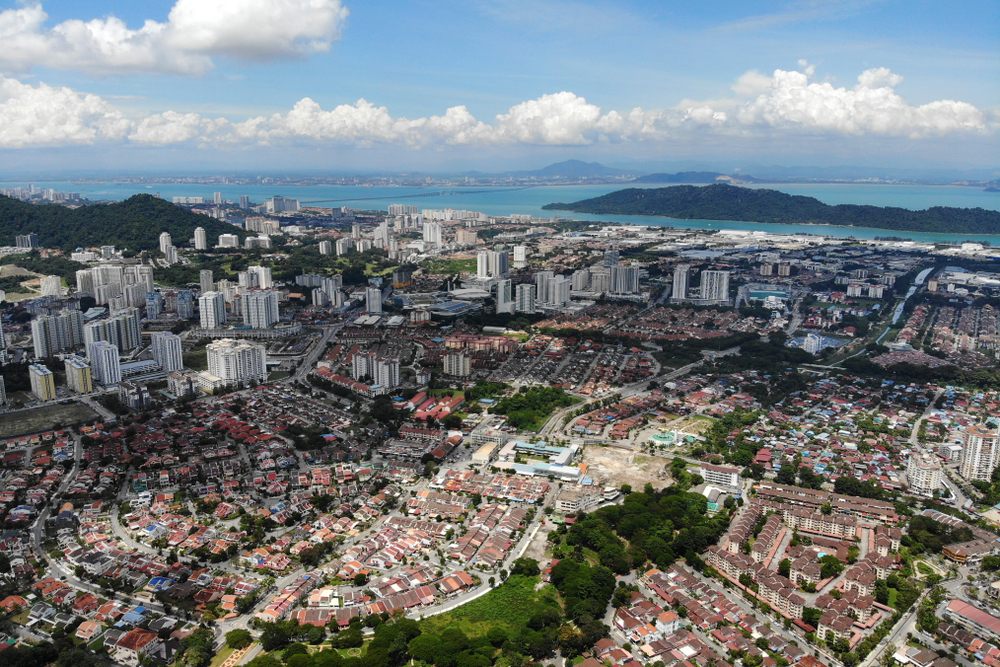
Aerial view of Bayan Lepas Industrial park, residential houses and commercial buildings (Courtesy: Shutterstock)
Methodology
LST is measured by collecting specific data (e.g. thermal, red and near-infrared bands) from a Landsat dataset to feed into a Geographic Information System (GIS) model, which then processes and combines the data with relevant parameters to determine the final LST value. Key parameters include top of atmosphere reflectance and brightness temperature, thermal emissivity and vegetation health data.
Disclaimers
The methodology does not include the direct collection of physical and biological information of objects (e.g. manmade, vegetations, water bodies, etc) in the study areas; rather it is based on a remote quantitative estimation of LST values, which can greatly vary depending on changes in surface energy. Surface temperature data are prone to errors due to clouds and cloud shadows, thus certain areas may have their temperatures underestimated. Temporal measurement is different for each city as timeframes could not be standardised (except for George Town and Bayan Lepas) due to data limitations; and was captured by two different satellites (Landsat 5 and Landsat 8) with slightly different thermal sensing capacity. Study areas also varied in sizes and some may show greater extremes in temperature change due to the capacity of larger areas to evolve and change (e.g. accept more substantial physical changes; for example, Johor Bahru district has more spatial capacity for further development compared to Kuala Lumpur City Centre).
References
►Hashim, N.B.M., Ahmad, A. and Abdullah, M., 2007. Mapping urban heat island phenomenon: Remote sensing approach.
The Institution of Engineers, Malaysia, 68, pp.25-30.
►Malakar, N.K., Hulley, G.C., Hook, S.J., Laraby, K., Cook, M. and Schott, J.R., 2018. An operational land surface temperature product for Landsat thermal data: Methodology and validation.
IEEE Transactions on Geoscience and Remote Sensing, 56(10), pp.5717-5735.
►Mustafa, E.K., Co, Y., Liu, G., Kaloop, M.R., Beshr, A.A., Zarzoura, F. and Sadek, M., 2020. Study for Predicting Land Surface Temperature (LST) Using Landsat Data: A Comparison of Four Algorithms.
Advances in Civil Engineering, 2020.
►Cook, M., Schott, J.R., Mandel, J. and Raqueno, N., 2014. Development of an operational calibration methodology for the Landsat thermal data archive and initial testing of the atmospheric compensation component of a Land Surface Temperature (LST) product from the archive.
Remote Sensing, 6(11), pp.11244-11266.
Sources
Data source: United States Geological Survey (USGS)
Data sets: Landsat Missions 5 and 8

Land Surface Temperature of Bayan Lepas
Land surface temperature of Bayan Lepas, Penang in 1988 and 2020.