Demographics of KLCCD
This map illustrates observable demographic trends and urban economies in KLCCD. Metrics of employment density and population density generated for this map are the measurements of job and resident concentrations dwelling every hectare of the area.
Employment density will give insights on the
vibrancy of economy in the area which are mostly retail, fashion-related industries and tourism services. Population density which entails residents' data shall intrinsically justify the hollowing event of the area after business hours.
Significant Trends and Key Insights
Employment Density
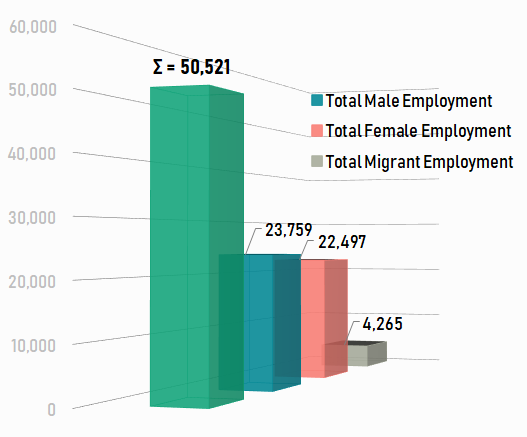
► In employment totality, it is estimated that there are 50,521 workers in the study area - an average of 443 workers per hectare.
► The number of male and female workers in the area is almost equally distributed.
► It is estimated that at least 8.4% of the workforce are non-Malaysian, the equivalent of 4,265 employees.
► Job density is highest along the central axis of the spine from Jalan Ampang to Chinatown and west along Leboh Pasar Besar.
Population Density
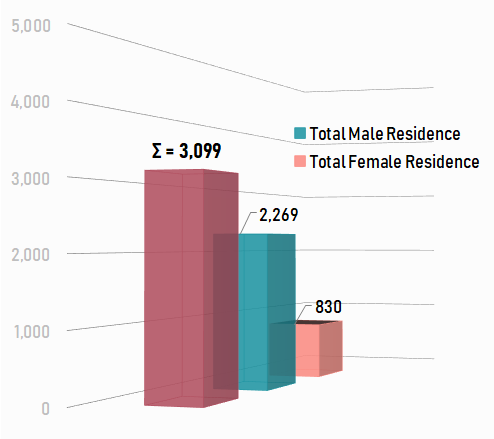
► The actual sleeping night-time population is less than 10% of the day-time population.
► The estimated number of residents in Downtown KL is 3,099 where the average population density is 21 people per hectare.
► The residential population is low and comprises of either high-end apartments housing professionals, or low-cost, migrant-housing for general workers and labours.
► Majority of households are in a north-south central corridor with concentrations in Masjid India, Leboh Ampang/Jalan Gereja Precinct and Chinatown.
► The lack of residents leads to minimal night-time activity, fewer 'eyes on the street' and a poor sense of community.
Sources
Think City; Downtown Kuala Lumpur Baseline Study, 2015