Demographics of GTWHS
This map illustrates observable social trend in the George Town World Heritage Site (GTWHS) between 2009 and 2013. The metric of population density generated for this map is the measurement of resident concentration dwelling every quarter of an hectare of the area.
This map shall show the net population change in GTWHS in 4 years time since being listed as a UNESCO World Heritage Site in 2008.
Slide right for the 2009 analysis and left for 2013 analysis.
Significant Trends and Key Insights
Population Density
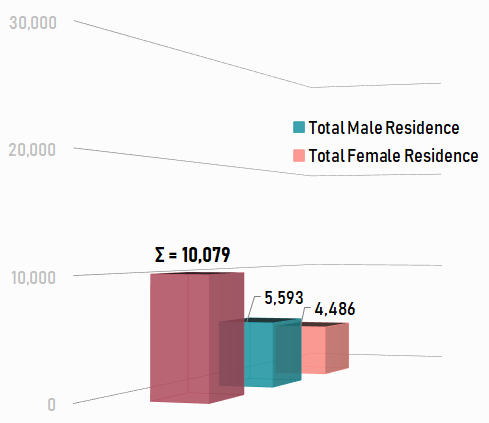
GTWHS population density in 2009
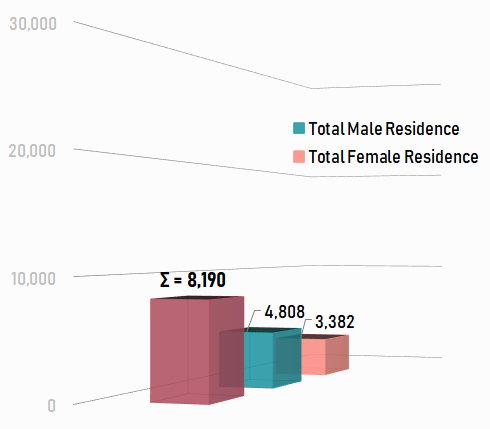
GTWHS population density in 2013
► Population decline has been largely due to the moving out of many traditional families from the area (net reduction 730 residents).
► There was a total loss of 590 households making up to almost 20% of population drop, with the prominent groups being female, children under the age of 15 and senior citizens aged 60 and above.
► Population density is highest around the clan jetties, the area between Lebuh Campbell and Chulia and a band between Lebuh Carnarvon and Pantai (to Lebuh Acheh).
► Spatially, the decline in population has been greatest in the waterfront areas, jetty communities and tourist precincts, with general increases in the central areas of GTWHS.
Sources
Think City; GTWHS: Population and Land Use Change, 2013

Demographics of GTWHS (Population)
Difference in population density between 2009 and 2013.
-
title
-
Help