Demographics of GTWHS
This map illustrates observable employment concentration in the George Town World Heritage Site (GTWHS) between 2009 and 2013. As users slide to the left, they shall be able to see the trend from 2013, and as they slide to the right, the trend from 2009 will appear suit. The metric of employment density generated for this map is the measurement of job concentration dwelling every quarter of an hectare of the area.
This map shall show the net employment change in GTWHS in 4 years time since being listed as a UNESCO World Heritage Site in 2008.
Slide right for the 2009 analysis and left for 2013 analysis.
Significant Trends and Key Insights
Employment Density
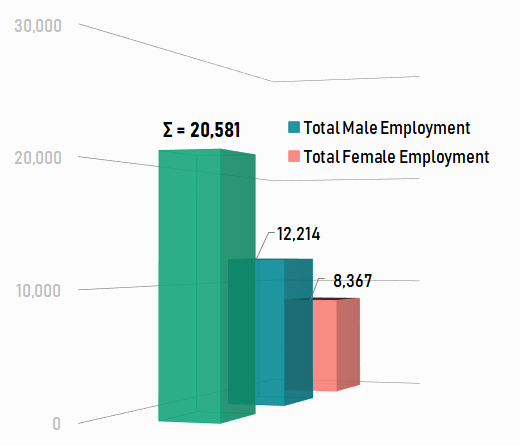
GTWHS employment density in 2009
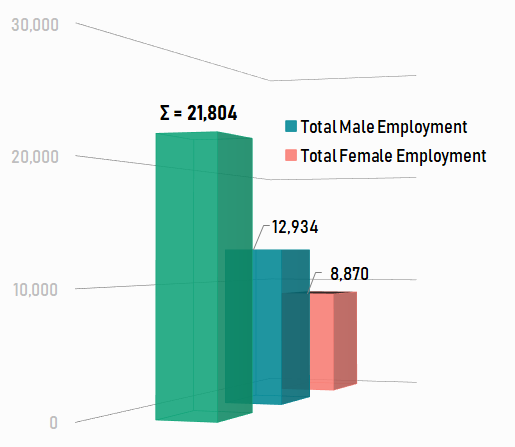
GTWHS employment density in 2013
► In the 4 years, the size of the workforce has remained relatively stable at around 22,000 which is mainly dominated by males.
► The labour force remains dominated by Chinese Malaysians, but there was a modest increase in Malay workers and a 33% increase in the number of migrant workers.
► The largest increases in employment were in the hospitality and the non-profit sectors.
► Spatially, the highest net increase in employment between 2009 and 2013 occured in the commercial areas of Lebuh Buckingham, and Lebuh Downing - where administrative offices such
Lembaga Hasil Dalam Negeri Pulau Pinang and Jabatan Hal Ehwal Agama Islam Pulau Pinang are located.
Sources
Think City; GTWHS: Population and Land Use Change, 2013
Next ▶ Demographics of GTWHS (Population)

Demographics of GTWHS (Employment)
Difference in employment density between 2009 and 2013.
-
title
-
Help